The AI Scoreboard
Why AI Adoption Should Not Be Measured by Usage Alone

As the World Cup approaches, every match reminds us of something leaders often forget:
Possession is not victory.
A team can dominate the ball, complete hundreds of passes, and still lose.
The same happens with AI.
A company can activate AI licenses, launch copilots, deploy agents, run internal workshops, and still fail to improve how work actually happens.
That is why this fourth article in The Human-AI Playbook matters.
In Article 1, we argued that 11 agents are not a team. Tools alone do not create an AI-native organization.
In Article 2, we argued that the first bad match is not failure. The early dip in AI adoption is often the cost of learning, verification, and redesign.
In Article 3, we argued that the same playbook will not work for every team. Context, diagnosis, capability, specs, and adaptation determine whether AI adoption succeeds or fails.
Now we arrive at the next question:
How do we know whether AI adoption is actually working?
Not whether it is visible.
Not whether people are experimenting.
Not whether a dashboard shows usage.
But whether AI is improving the system.
That is where the scoreboard matters.
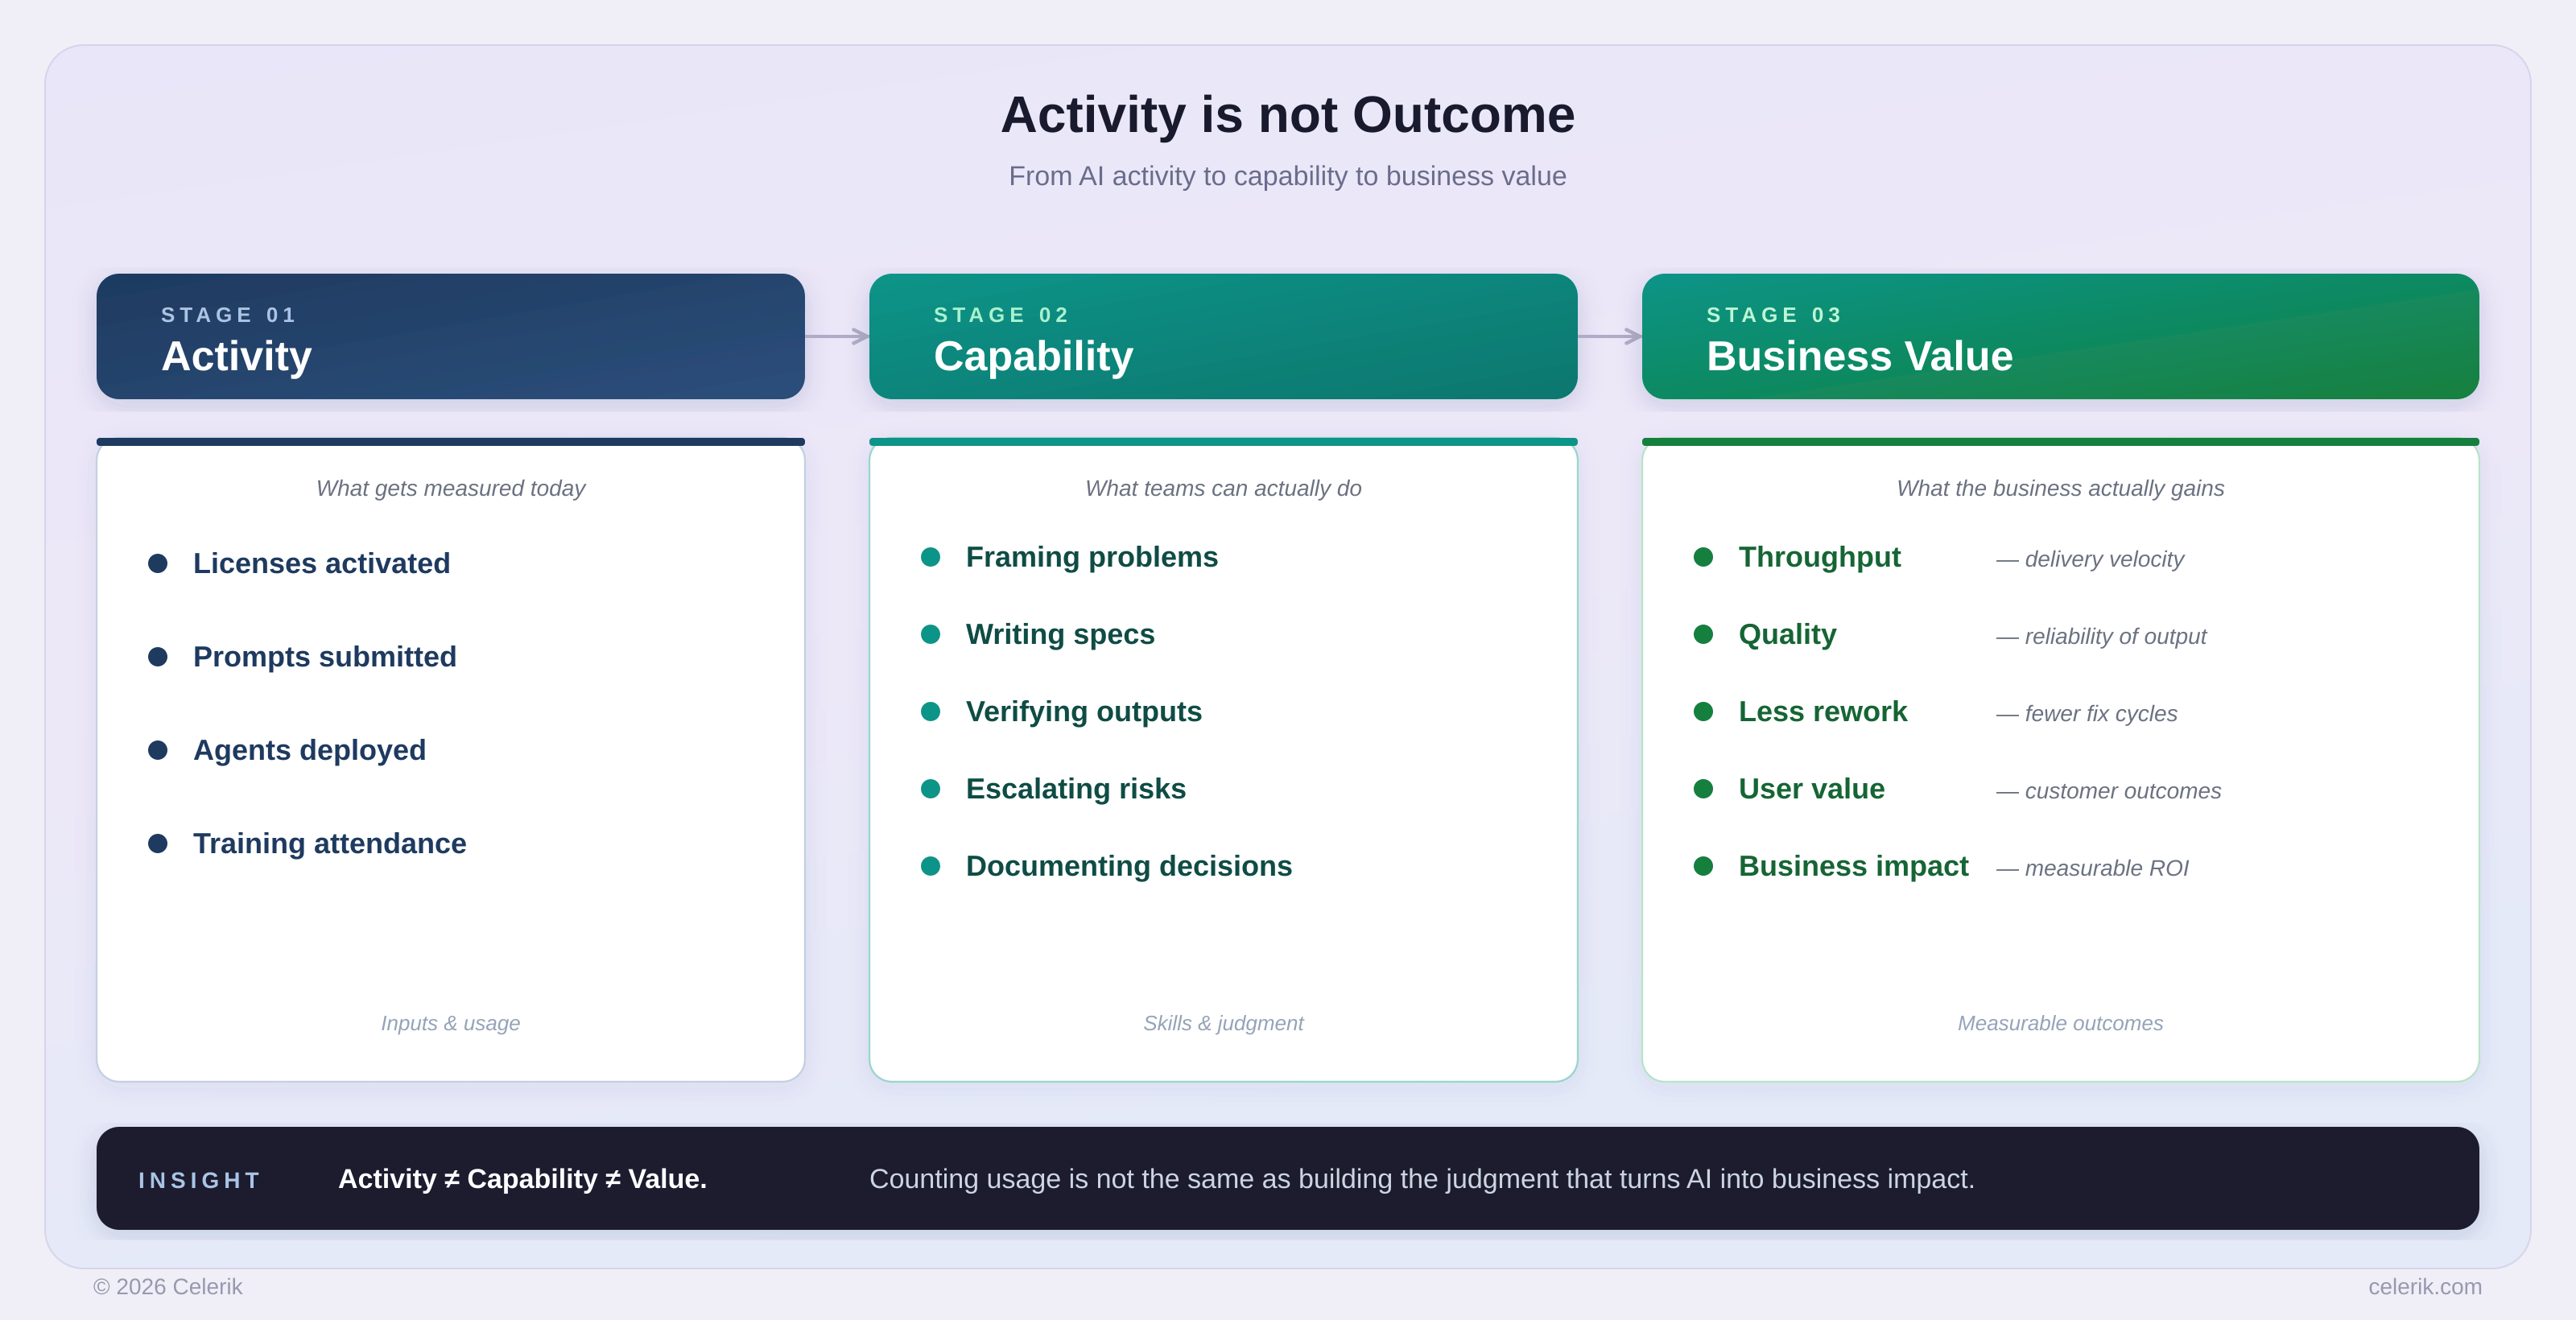
Possession, attendance, and usage are not transformation
Football teaches one version of this lesson.
Education teaches another.
In football, possession is not victory.
In education, attendance is not learning.
In AI adoption, usage is not transformation.
A player can touch the ball many times and still fail to create value for the team.
A student can attend a class and still not develop capability.
An employee can use AI every day and still produce more rework, more risk, or more confusion.
That distinction is essential.
From my doctoral and research background, one of the strongest lessons is that delivery is not the same as appropriation, and exposure is not the same as transformation.
A workshop delivered is not the same as a capability developed.
A tool deployed is not the same as a workflow improved.
A prompt executed is not the same as a decision made better.
So the question cannot be only:
Did people attend?
It must be:
Can they do something better now?
And in AI adoption, the question cannot be only:
Are people using AI?
It must be:
Is the organization working better because of AI?
That is a much harder question.
And a much more valuable one.
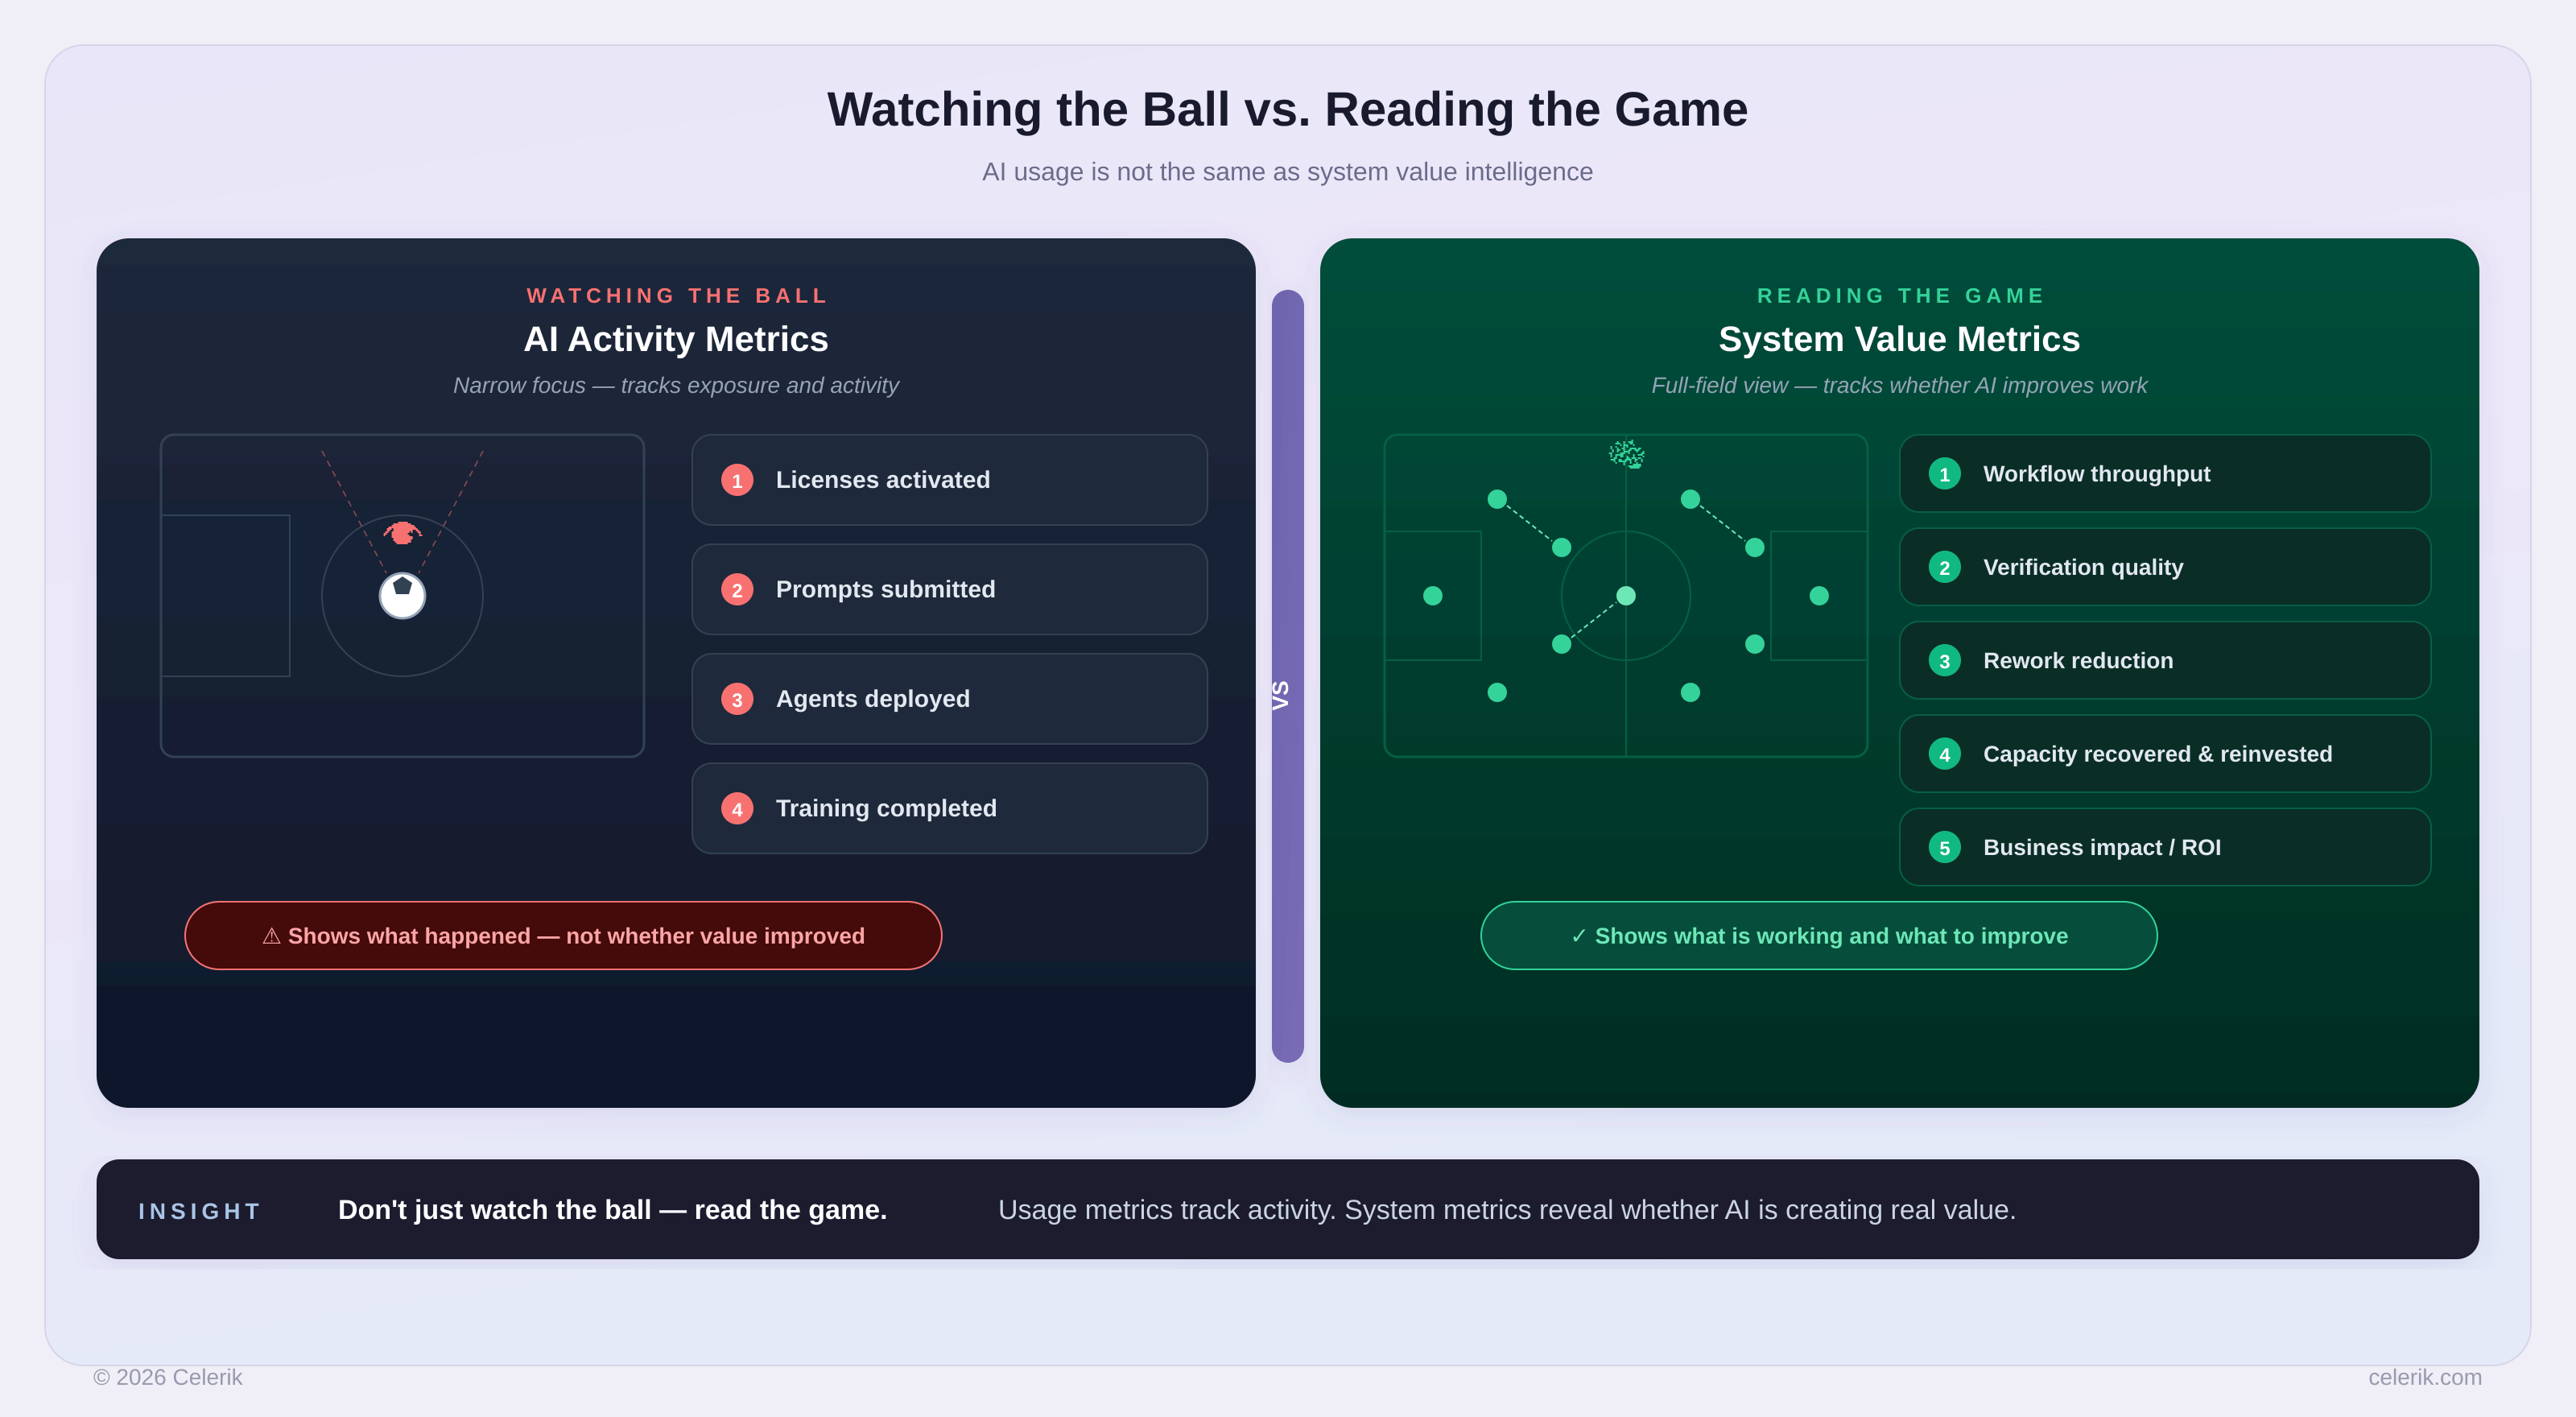
The wrong scoreboard
Many companies build their AI story around what is easiest to count:
- AI licenses activated,
- active users,
- training completion,
- prompts submitted,
- agents deployed,
- lines of code generated,
- demos delivered.
These numbers are useful.
They show exposure.
They show experimentation.
They show momentum.
But they do not prove value.
A company may report high AI usage and still experience:
- heavier review burden,
- inconsistent outputs,
- more rework,
- quality drift,
- unclear ownership,
- hidden risk,
- weak ROI.
This is the first mistake the AI Scoreboard must correct.
Activity metrics should be treated as the opening statistic.
Never as the final score.
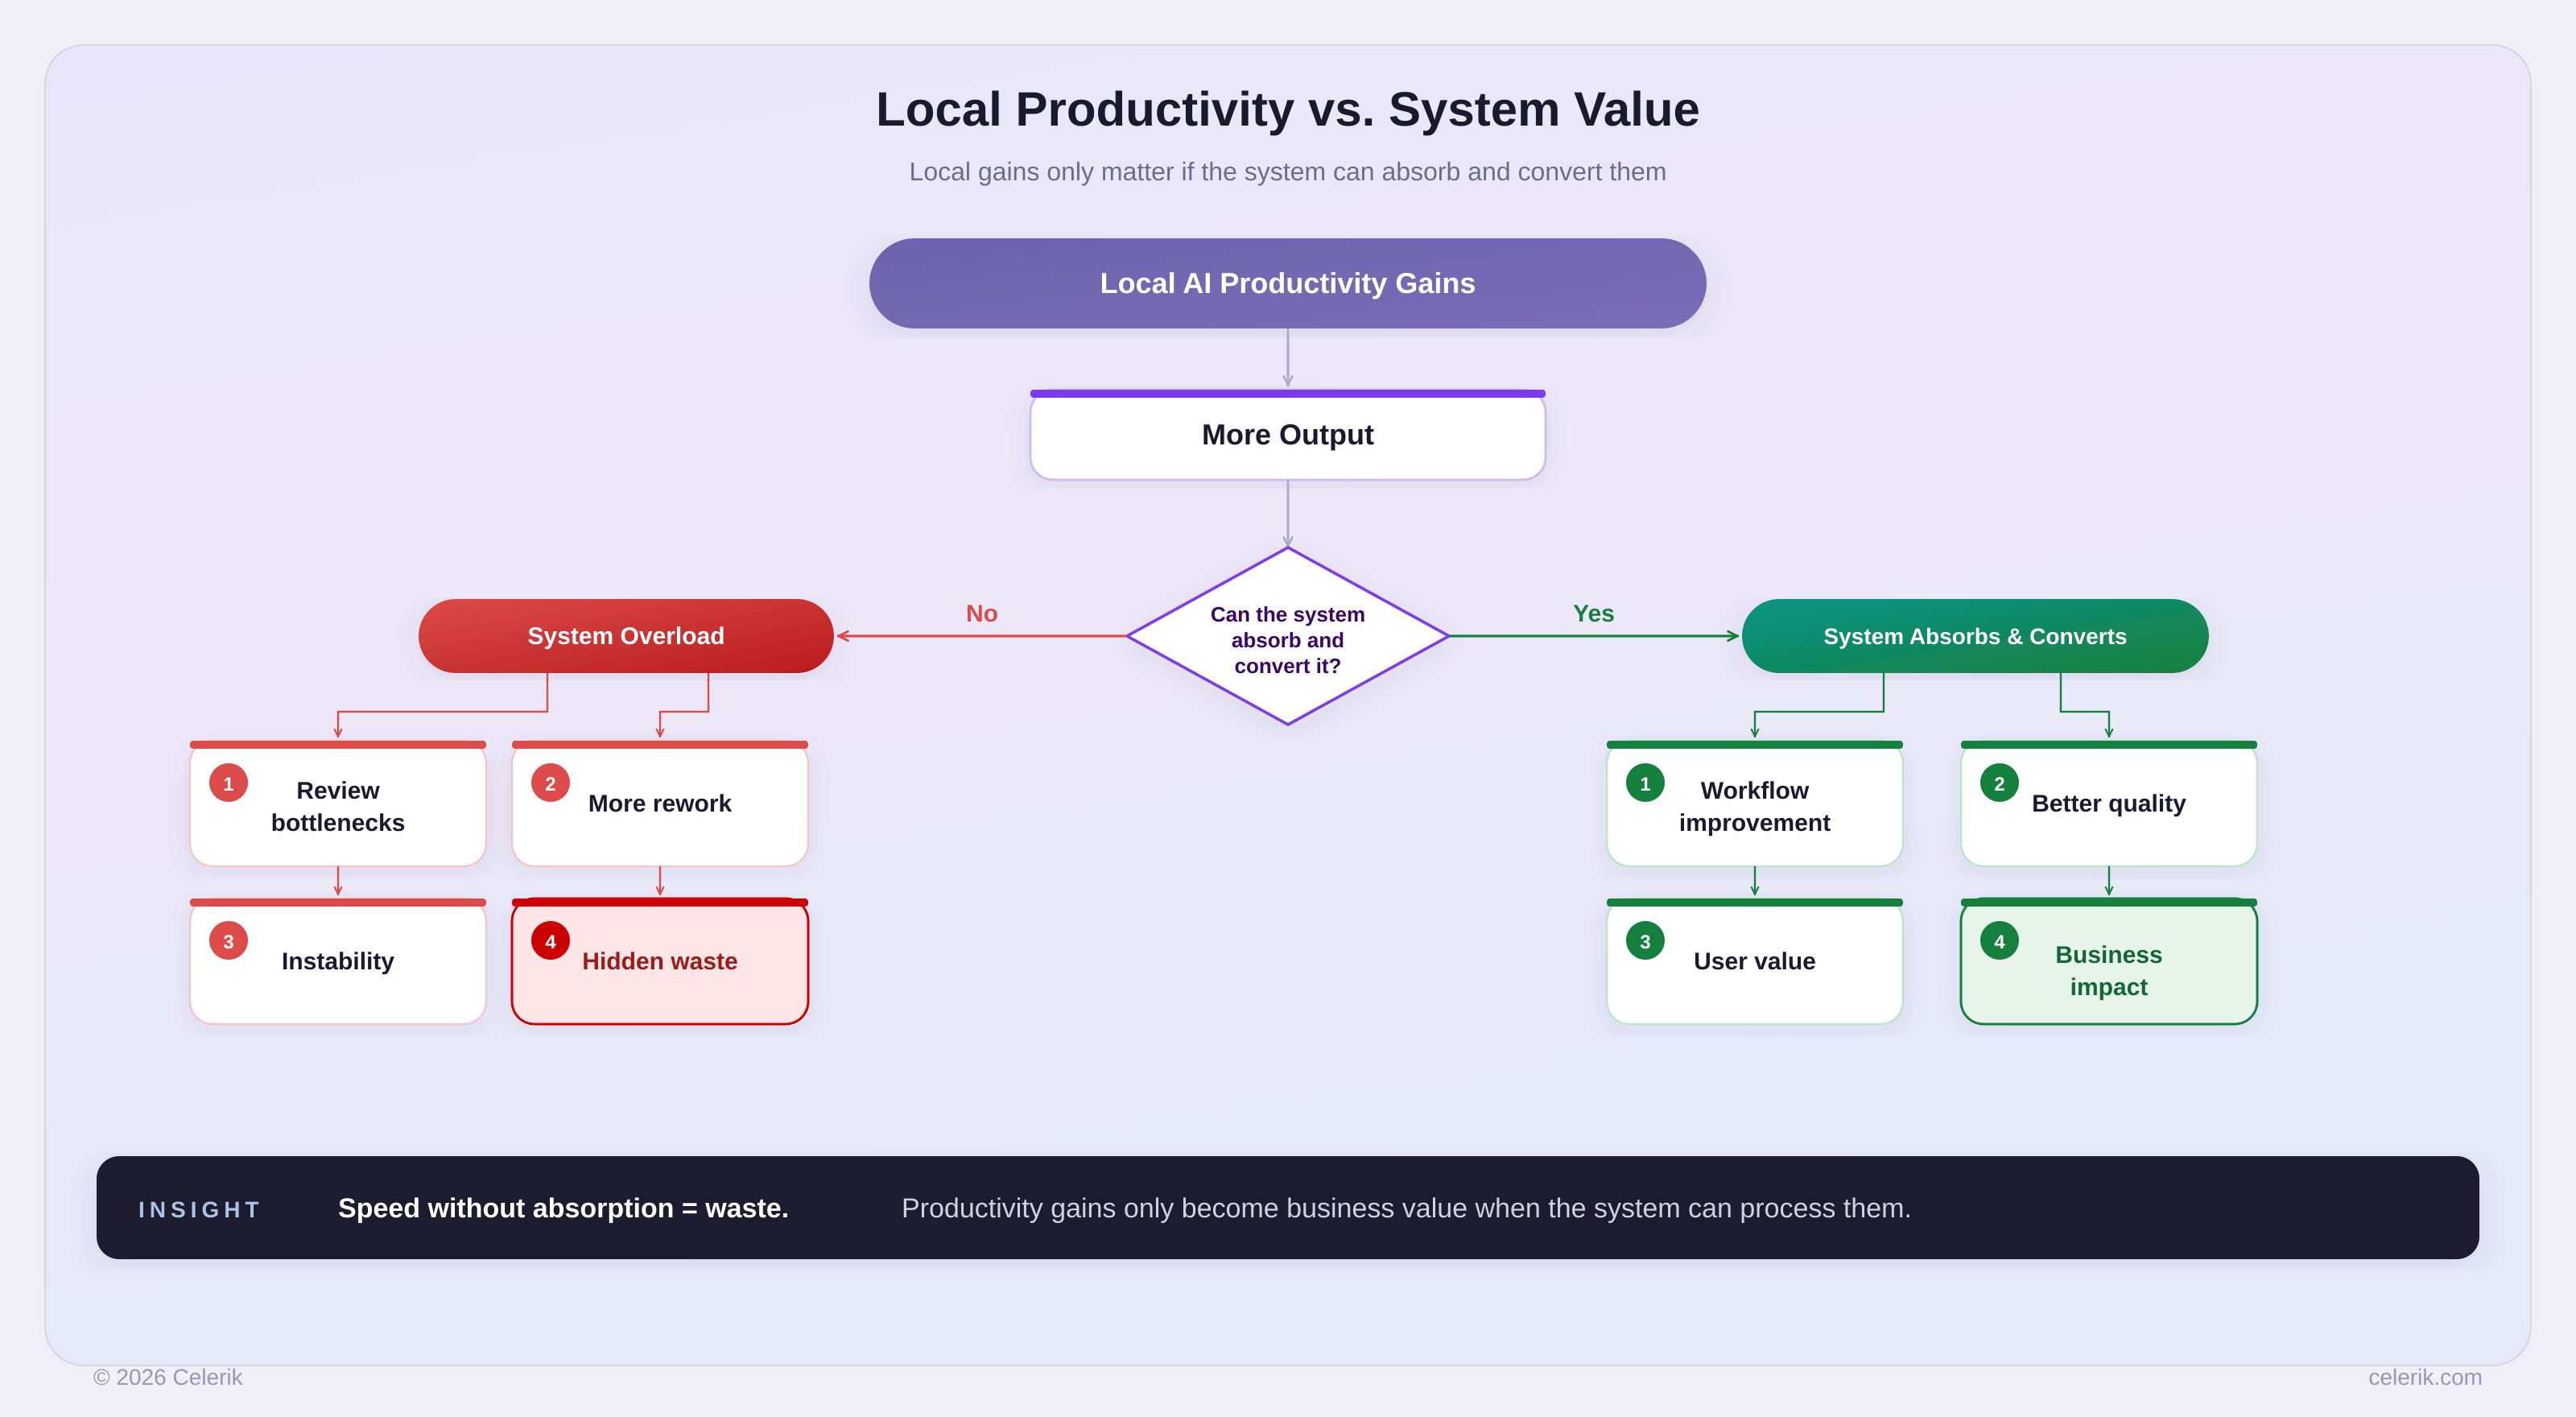
What DORA helps us see
DORA is useful because it gives technology leaders a language for connecting engineering work with system performance and financial impact.
Its contribution is not just technical.
It is strategic.
It teaches us to look beyond local efficiency and ask whether the entire system is performing better.
That is critical for AI adoption.
A developer may generate code faster.
But if code review gets overloaded, defects rise, and releases become unstable, the system has not improved.
A product team may produce drafts faster.
But if those drafts require heavy correction or delay decisions, the system has not improved.
A group may automate a workflow step.
But if quality, trust, or coordination breaks elsewhere, the organization has only moved the burden.
We already discussed the J-Curve, the verification tax, and AI as an amplifier in Article 2.
Here, the key point is different:
AI measurement must connect local productivity with system value.
Google Cloud describes the purpose of its DORA ROI framework as bridging the gap between engineering speed and financial impact. The framework also emphasizes budgeting for the J-Curve, reinvesting recovered capacity instead of treating AI solely as a headcount-reduction mechanism, and translating technical performance into financial outcomes. Google Cloud
Human-AI Work Design adds another layer:
Are humans and AI learning to work together in a way that improves the whole system?
That is the scoreboard we need.
Beyond benchmarks: the business value test
This is also why the broader AI conversation is moving beyond model benchmarks.
Satya Nadella has argued that AI success should be measured by real economic impact, not only by technical benchmarks or model performance. That distinction matters for enterprise AI adoption. The Economic Times
A model can perform well on a benchmark.
A coding assistant can generate more code.
An agent can complete more tasks.
But the business question is different:
Did the organization create more value?
Did quality improve?
Did rework decrease?
Did teams free capacity for higher-value work?
Did customer outcomes improve?
Did AI change the economics of delivery?
That is why the AI Scoreboard cannot stop at usage or technical performance.
It has to connect AI adoption to workflow performance, human capability, and business value.
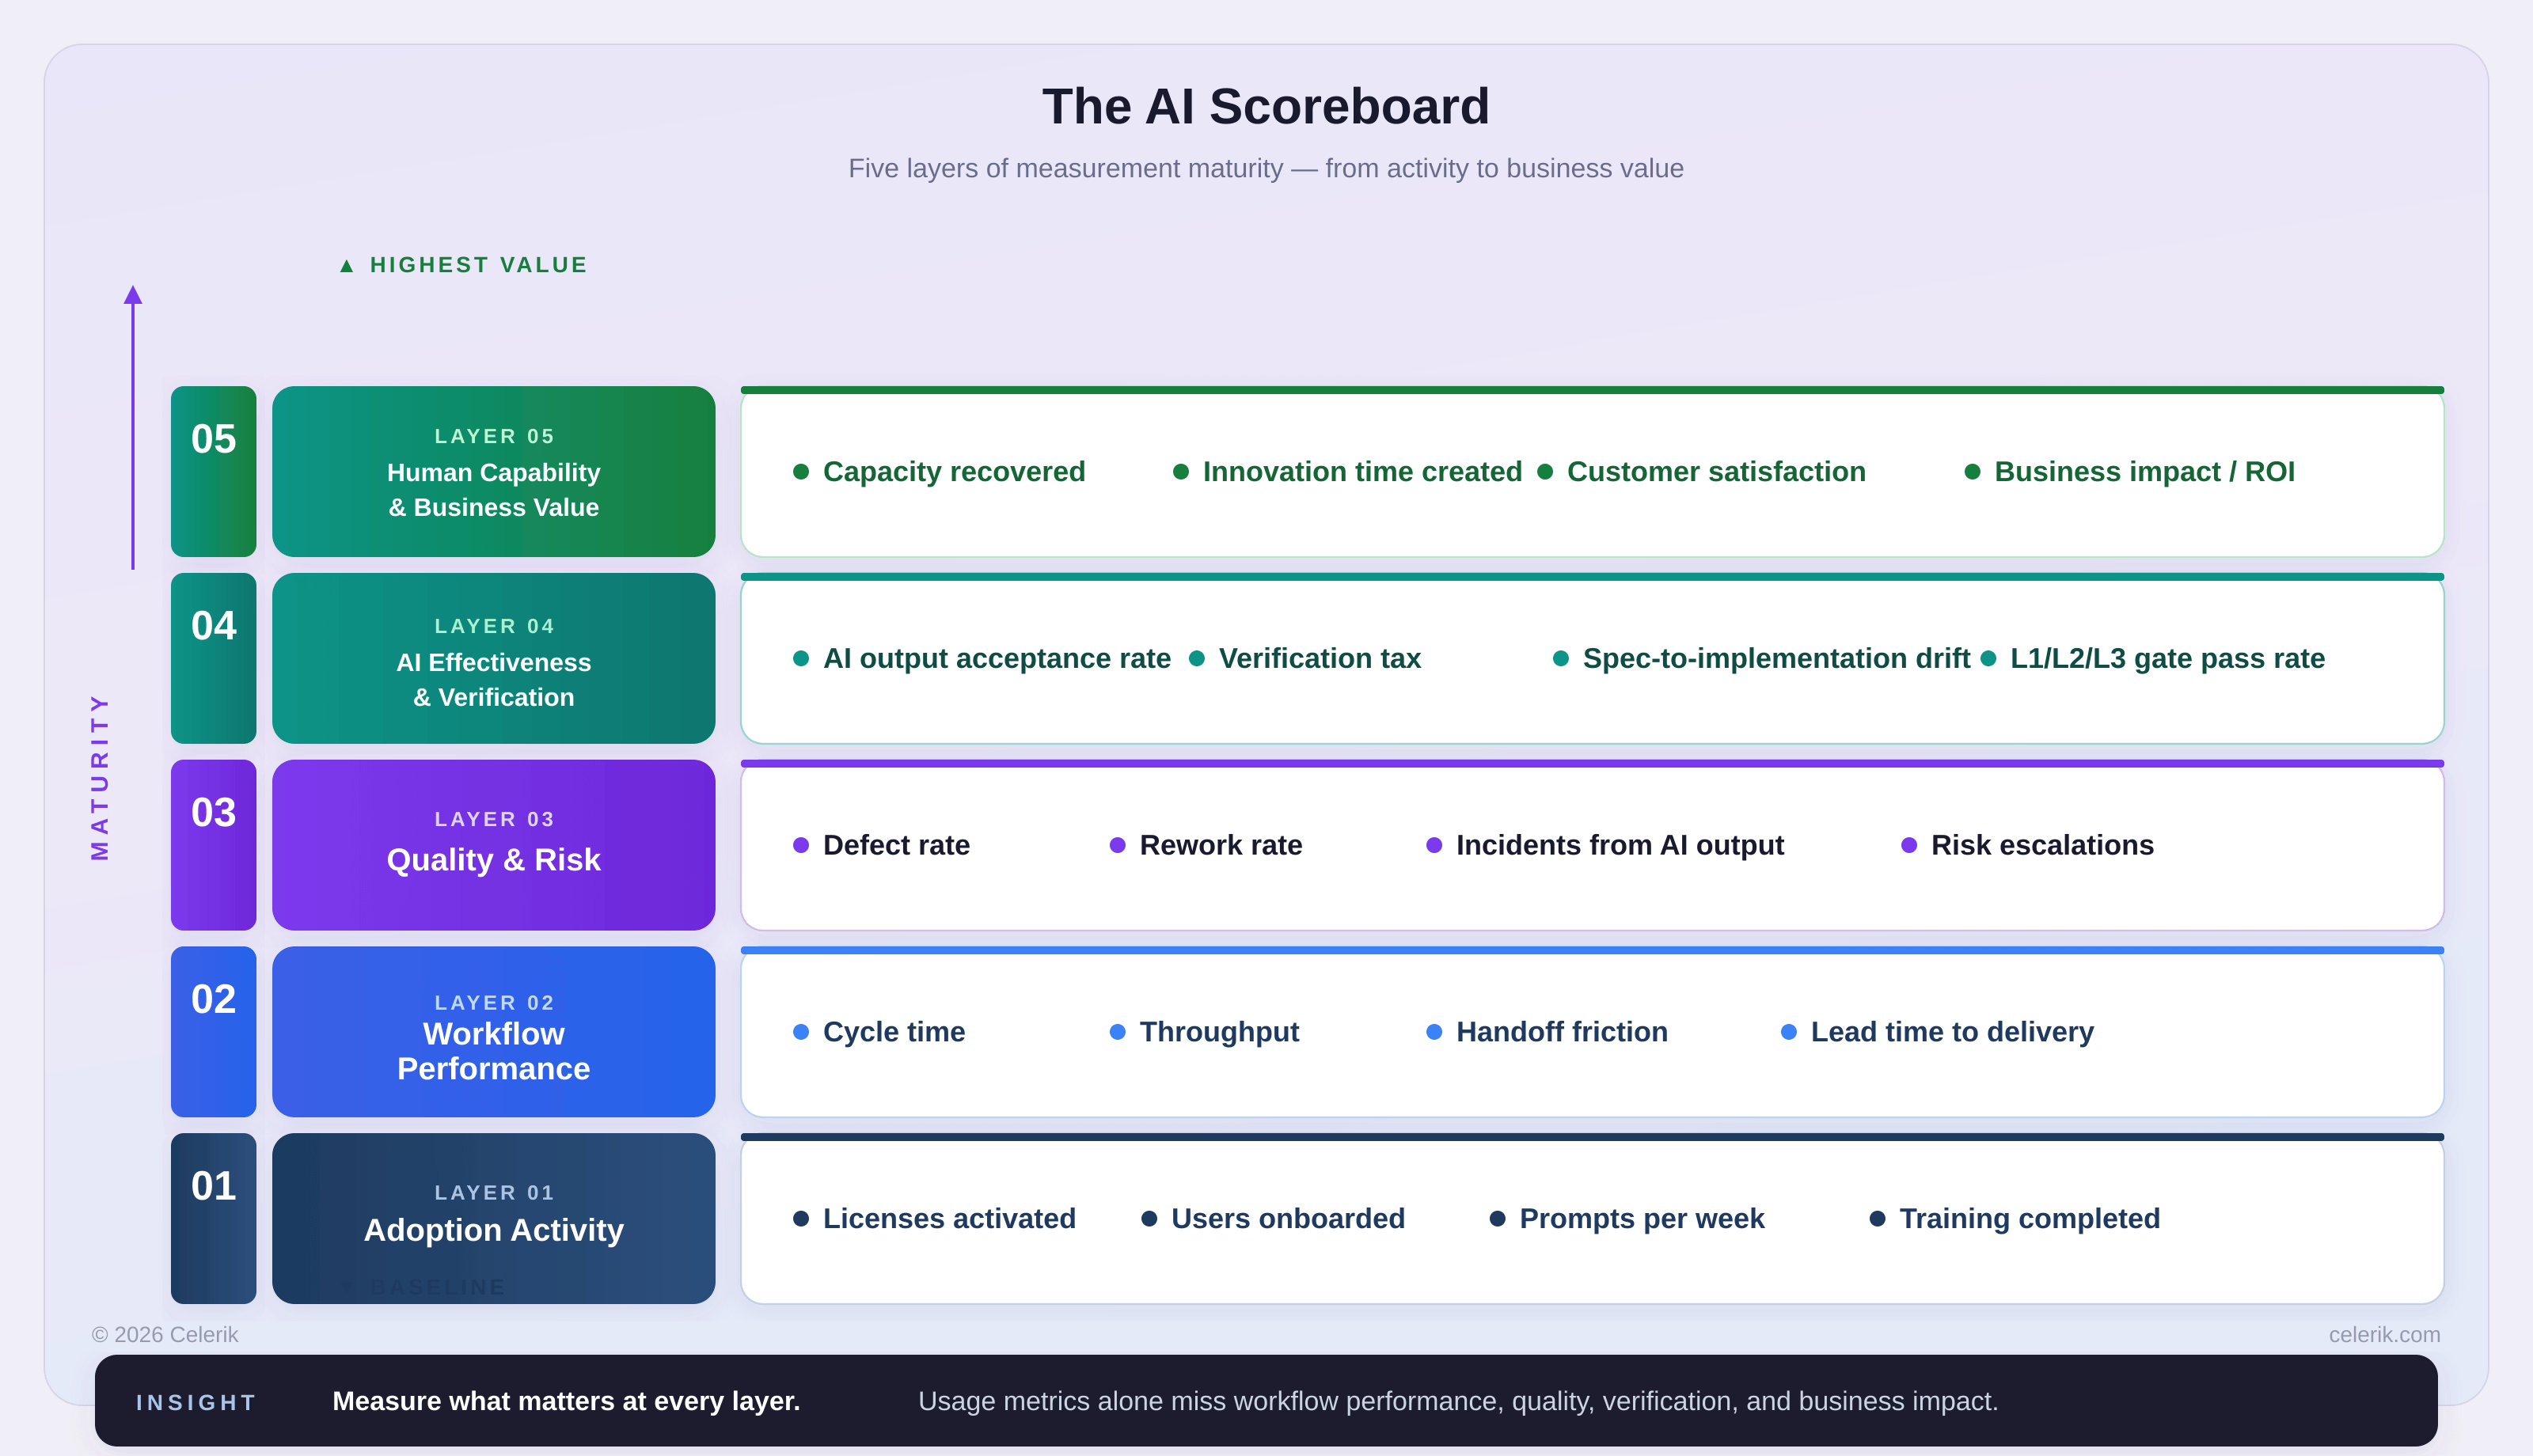
The AI Scoreboard: five layers to measure
A useful AI Scoreboard should not ask only whether AI is being used.
It should show whether AI is improving the work system.
At Celerik, we think about this through five layers.
Layer 1 — Adoption activity
This layer answers:
Is AI being used?
Example variables:
- active AI users,
- license utilization,
- prompt volume,
- agent usage,
- AI-assisted tasks,
- training completion.
These indicators are necessary.
But they are not enough.
They tell us whether people are touching the ball.
They do not tell us whether the team is winning.
Layer 2 — Workflow performance
This layer answers:
Is valuable work moving better through the system?
Example variables:
- lead time,
- cycle time,
- review time,
- handoff time,
- blocked time,
- throughput,
- deployment frequency,
- backlog movement.
This is where adoption starts becoming operationally meaningful.
If AI generates more output but review time doubles, the system has not improved.
If AI accelerates coding but testing becomes the new bottleneck, the system has not improved.
If AI helps one role move faster but slows down another, the scoreboard must show it.
Layer 3 — Quality and risk
This layer answers:
Is speed becoming safer, or is it creating hidden instability?
Example variables:
- defects after merge,
- escaped defects,
- change failure rate,
- rework rate,
- security findings,
- policy violations,
- hallucination or fabrication incidents,
- architecture review findings,
- compliance exceptions,
- verification burden.
This layer protects the organization from false optimism.
A football team that attacks more but concedes more has not necessarily improved.
A software team that generates more code but creates more instability has not necessarily improved.
Layer 4 — AI effectiveness and verification
This layer answers:
Is AI producing work that humans can trust, verify, and reuse?
Example variables:
- AI output acceptance rate,
- AI output rejection rate,
- percentage of AI-assisted PRs,
- number of review cycles per AI-assisted item,
- spec-to-implementation drift,
- prompt/spec reuse rate,
- context completeness score,
- verification tax,
- L1/L2/L3 gate pass rate,
- release evidence completeness.
This is where a generic AI dashboard becomes a Human-AI Work Design dashboard.
It does not only ask:
Did AI produce something?
It asks:
Was the output aligned, verifiable, reusable, and safe to integrate?
Layer 5 — Human capability and business value
This layer answers:
Is the organization becoming more capable and creating measurable value?
Example variables:
- capacity recovered,
- rework reduced,
- innovation time created,
- developer experience,
- user experience,
- customer satisfaction,
- cost efficiency,
- time to value,
- business impact,
- evidence of role-based AI capability.
This is the layer that matters most to leadership.
But it cannot be inferred from AI usage alone.
A company needs evidence that AI is improving how people work, how teams learn, and how value is delivered.
From usage to capability
What we are trying to understand is not only:
How much AI is being used?
But:
How capable is the organization becoming?
That shift matters.
In education, we know that content delivery is not enough.
In HCI, we know that access is not enough.
In NUI, we know that interaction is not enough if people cannot truly appropriate the system.
A person may have access to a digital tool and still not know how to use it meaningfully.
A user may see a conversational interface and still not understand what to ask, what to trust, or how to act on the response.
A team may receive a new AI assistant and still not know how to integrate it into its real workflow.
So in enterprise AI, we should not ask only:
Did people attend the training?
We should ask:
Can they use AI inside their real work?
Not only:
Did they write prompts?
But:
Can they frame better problems?
Not only:
Did AI generate an answer?
But:
Can the human verify whether the answer is useful, safe, and aligned with the context?
Not only:
Did the team adopt the tool?
But:
Did the workflow improve?
That is the measurement shift.
From attendance to capability.
From usage to appropriation.
From activity to performance.
In enterprise AI, usage is not enough if teams cannot:
- frame better problems,
- write better specs,
- verify outputs,
- escalate risk,
- document decisions,
- use AI responsibly in context,
- reduce rework,
- improve real work outcomes.
This is why the AI Scoreboard should also help leaders measure capability formation.
That is how AI adoption becomes organizational learning.
And that is what makes the scoreboard part of Human-AI Work Design rather than a generic analytics dashboard.
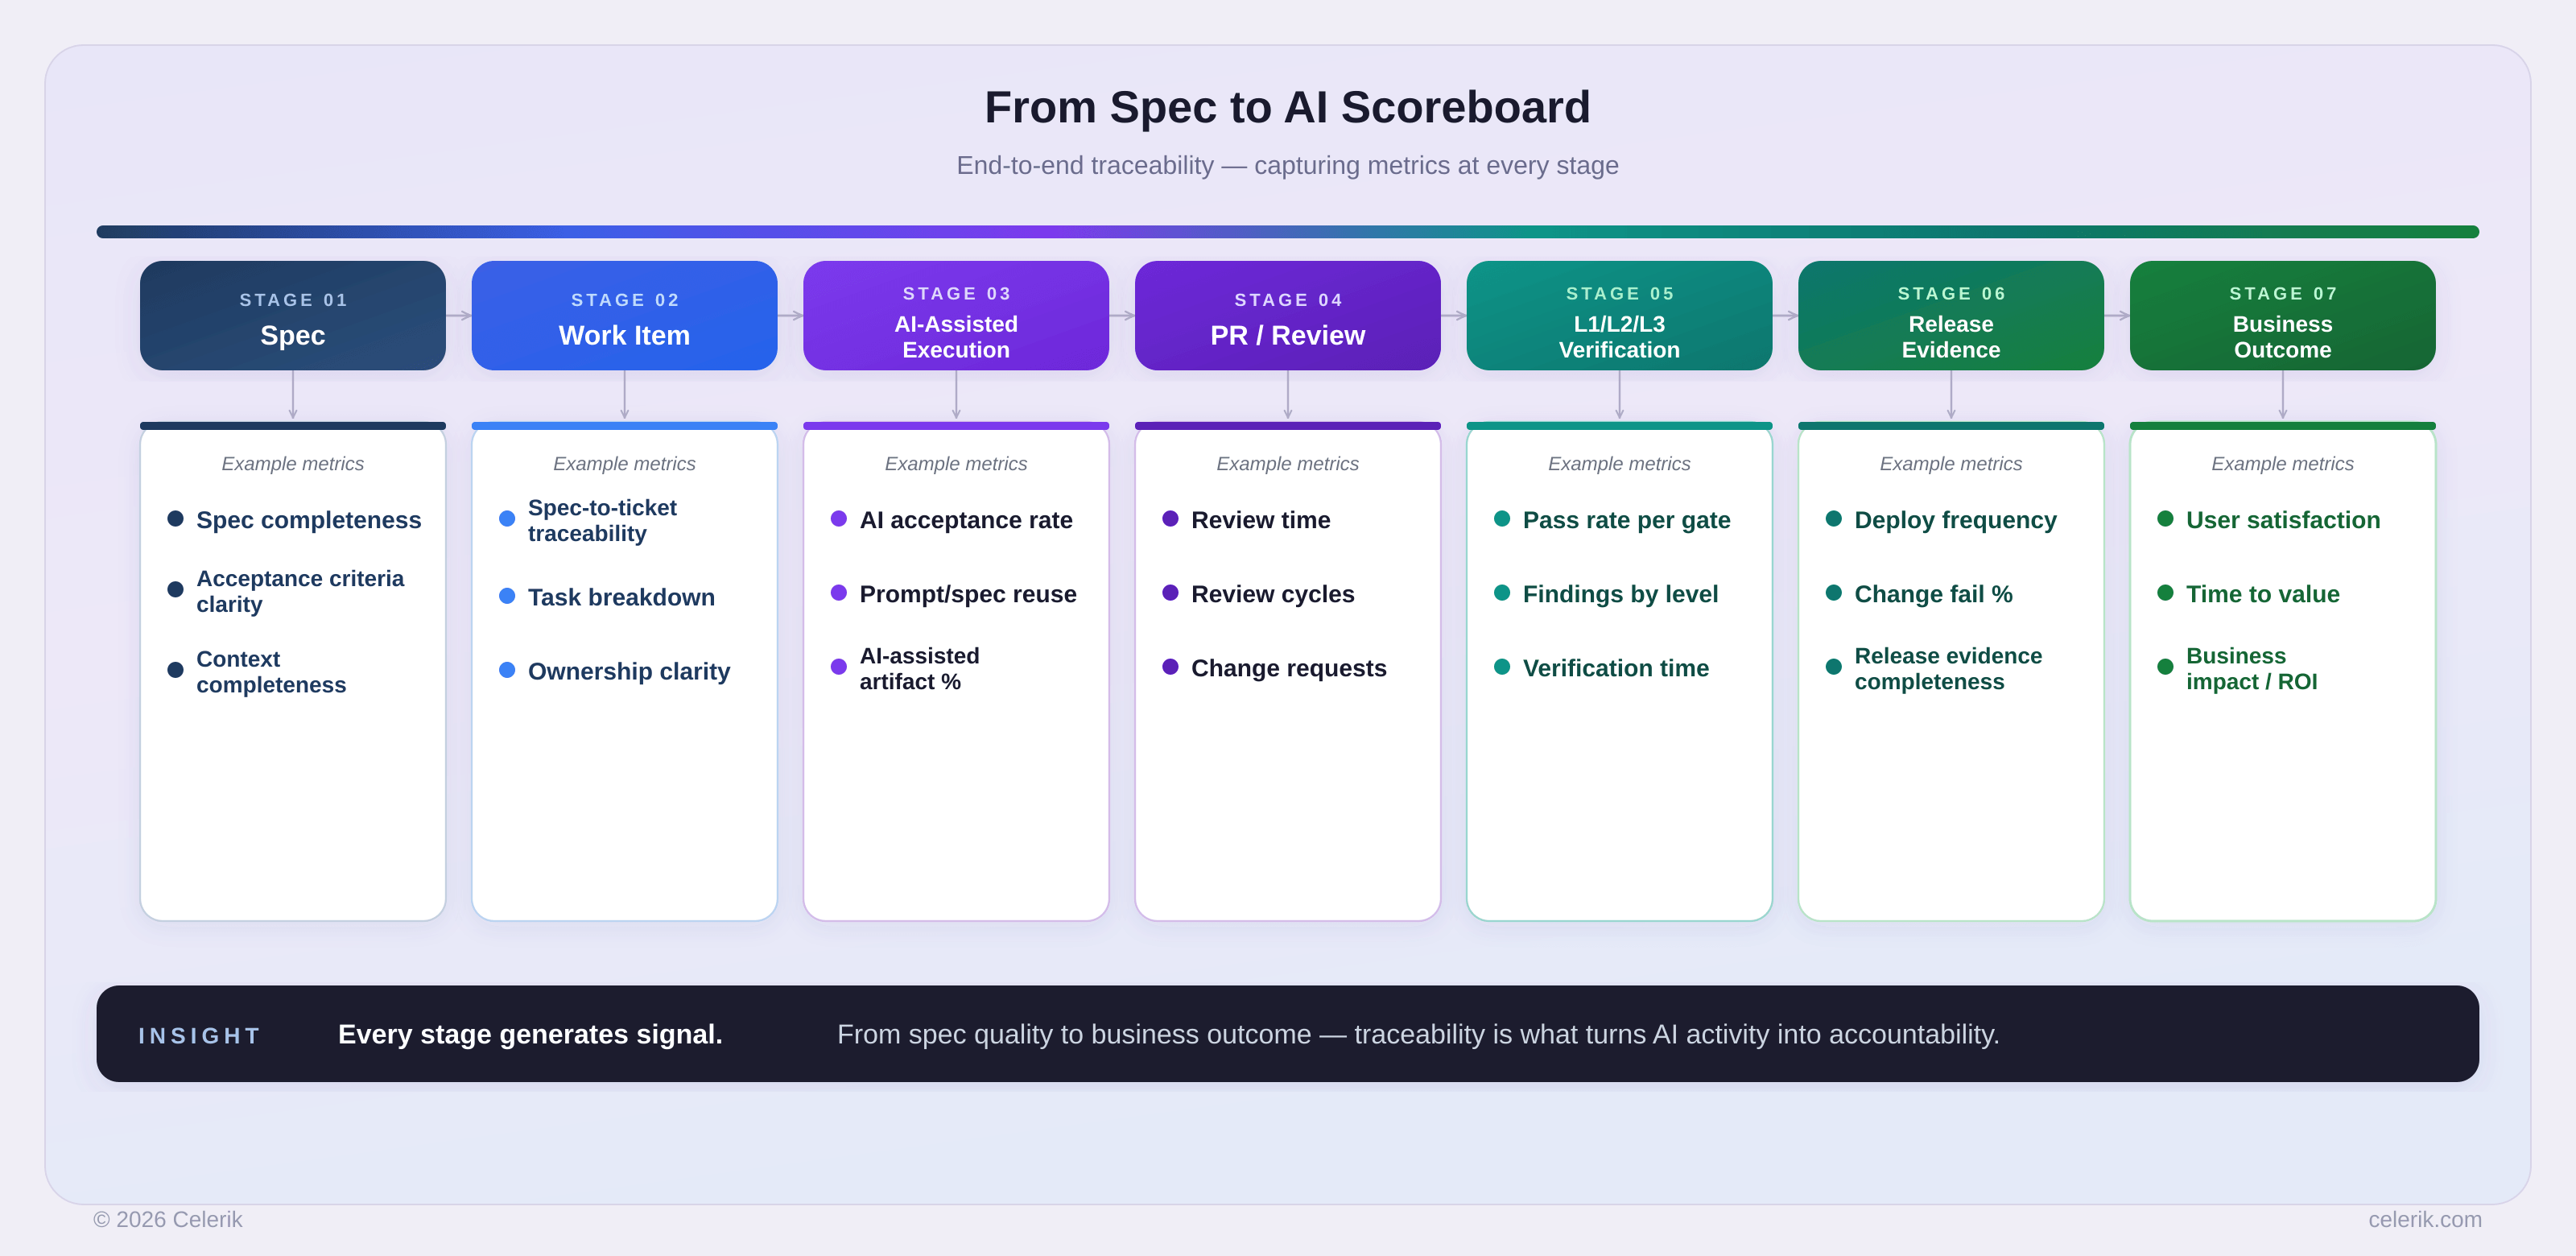
How to instrument the scoreboard in software delivery
The scoreboard becomes useful only when it is connected to the artifacts and events of real work.
In AI-assisted software delivery, the measurement system should not live outside the workflow.
It should be captured across the delivery chain.
As we discussed in Article 3, spec-driven development becomes important because the spec acts as a context artifact. It makes human intent more legible to AI and gives the team something concrete to verify against.
At Celerik, we have been adapting this logic through a Spec Kit-inspired approach and our own AI-assisted delivery practices.
The idea is simple:
If the workflow is traceable, the scoreboard can become evidence-based.
A practical instrumentation path looks like this.
1. Start with the spec
The spec is not just documentation.
It is the first measurable expression of intent.
Possible variables:
- spec completeness,
- acceptance criteria clarity,
- risk tags,
- context completeness,
- linked business objective,
- linked constitution or standard,
- definition of done,
- expected evidence.
If the spec is weak, the AI output will be harder to evaluate.
A vague playbook produces vague execution.
2. Connect the spec to the work item
The work item should preserve the link between business intent, technical scope, and execution.
Possible variables:
- spec-to-ticket traceability,
- task decomposition quality,
- estimation variance,
- ambiguity flags,
- blocked time,
- handoff count,
- ownership clarity.
This helps identify whether AI is accelerating work or simply moving ambiguity downstream.
3. Track AI-assisted execution
When AI assists with code, tests, documentation, analysis, or review, the team should capture enough evidence to evaluate the assistance.
Possible variables:
- AI-assisted artifact type,
- AI-generated code percentage,
- AI-suggested tests,
- AI-generated documentation,
- accepted versus rejected AI suggestions,
- human rewrite effort,
- number of iterations,
- prompt/spec reuse,
- context sources used.
The goal is not surveillance.
The goal is learning.
If AI consistently helps with certain tasks, scale that pattern.
If AI creates rework in others, redesign the workflow.
4. Measure review and verification
This is where the scoreboard becomes serious.
A review process should capture not only whether something was approved, but what kind of verification was required.
At Celerik, we have been exploring this through our quality management layer and QMing-style routines, where AI-assisted delivery is connected to review, traceability, and release evidence.
For readers unfamiliar with that language, the principle is straightforward:
QMing is not about adding bureaucracy. It is about making quality observable inside AI-assisted work.
One way to organize this is through a three-layer review model:
- L1 — Preventive checks: formatting, linting, static analysis, secrets detection, dependency checks, and basic policy checks.
- L2 — Assisted quality review: architecture concerns, test gaps, edge cases, maintainability, security suggestions, and AI-assisted review comments.
- L3 — Governance and intent alignment: whether the implementation matches the spec, risk profile, constitution, and expected business outcome.
Possible variables:
- L1 pass/fail rate,
- L2 findings per PR,
- L3 mismatches,
- review time,
- number of review cycles,
- rejected AI outputs,
- security findings,
- test gaps,
- spec-to-implementation drift,
- release evidence completeness.
This article introduces L1/L2/L3 as part of the scoreboard.
The next article, The AI VAR, will go deeper into how these layers help teams design verification, trust calibration, and accountability without slowing everything down.
5. Close the loop with release evidence
The final question is not whether the work was generated.
It is whether it created value safely.
Possible variables:
- deployment frequency,
- lead time to release,
- change failure rate,
- failed deployment recovery time,
- post-release defects,
- customer impact,
- user value signal,
- rework after release,
- business outcome linked to the feature.
This is where local productivity becomes system value.
Or where the scoreboard reveals that it did not.
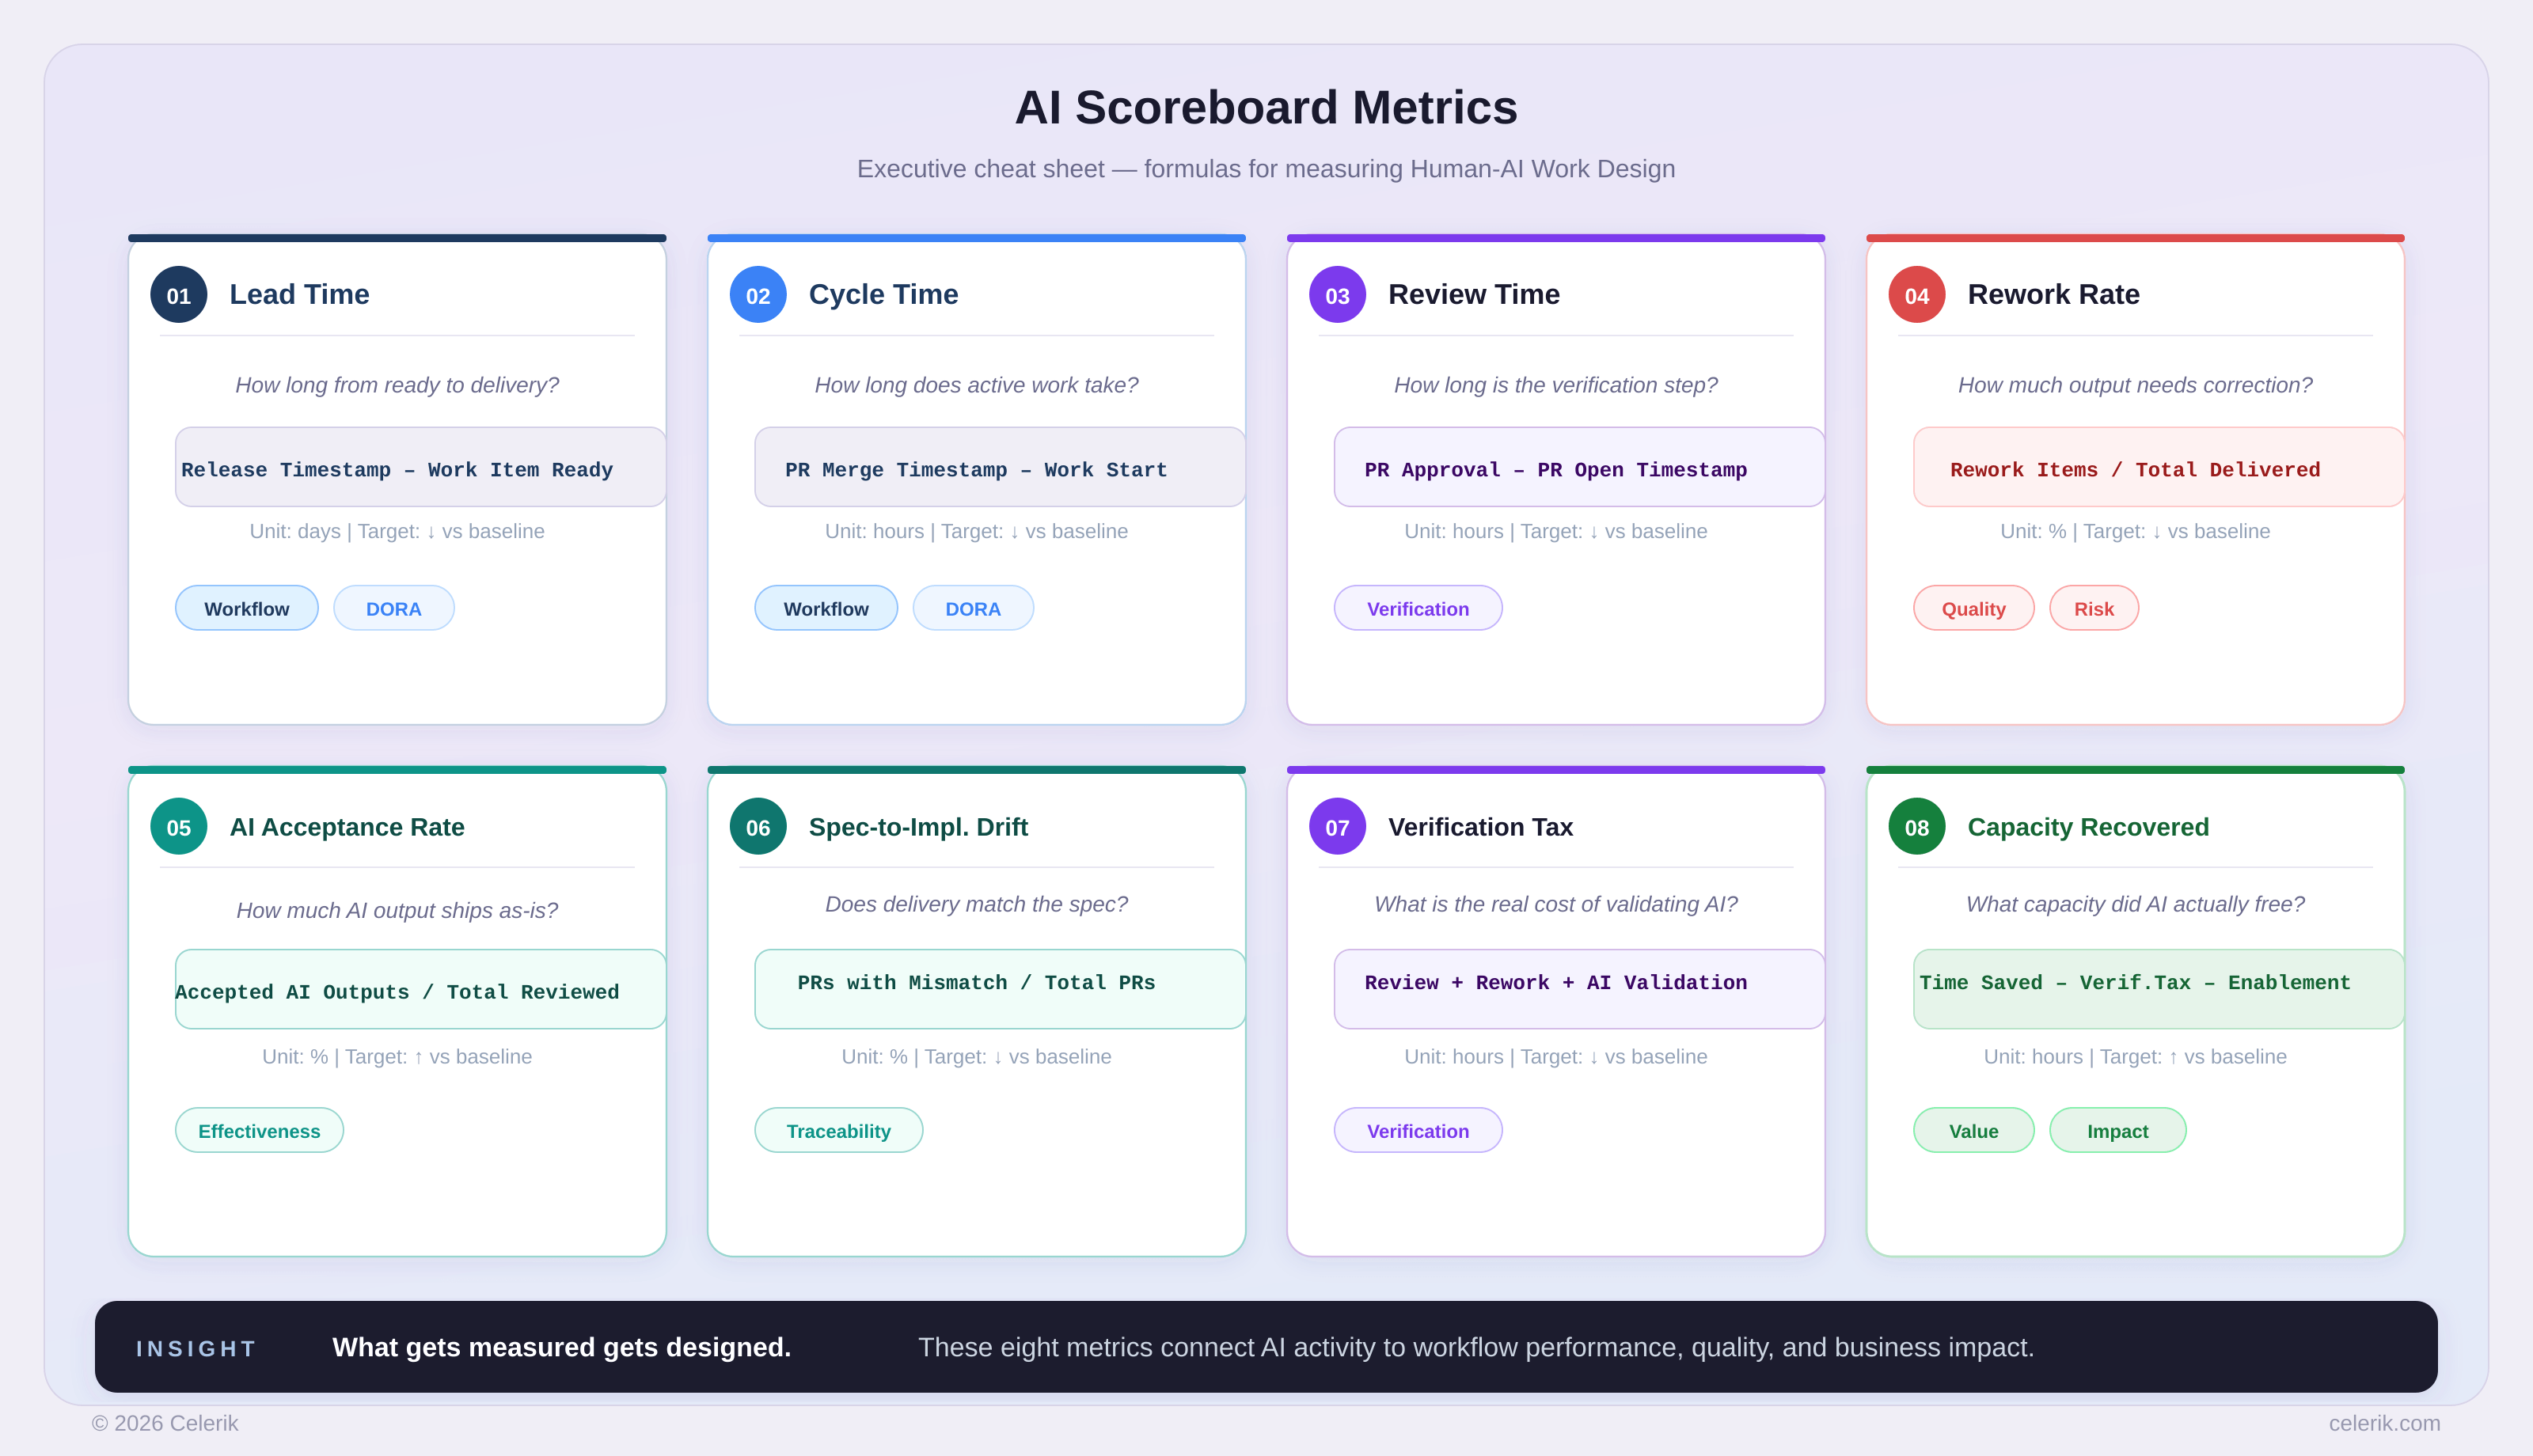
Practical metric formulas
A good scoreboard needs definitions.
Otherwise, every team measures differently.
Here are examples of useful formulas.
Lead time
Lead Time = Release Timestamp - Work Item Ready Timestamp
Use this to measure how long it takes for valuable work to move from readiness to delivery.
Cycle time
Cycle Time = PR Merge Timestamp - Work Start Timestamp
Use this to understand execution flow once work begins.
Review time
Review Time = PR Approval Timestamp - PR Open Timestamp
Use this to detect whether AI-generated output is increasing or reducing review burden.
Rework rate
Rework Rate = Rework Items / Total Delivered Items
Use this to measure whether AI is reducing avoidable correction or simply shifting it downstream.
AI output acceptance rate
AI Output Acceptance Rate = Accepted AI Outputs / Total AI Outputs Reviewed
Use this to identify where AI support is reliable.
AI output rejection rate
AI Output Rejection Rate = Rejected AI Outputs / Total AI Outputs Reviewed
Use this to identify where AI is creating waste or risk.
Spec-to-implementation drift
Spec-to-Implementation Drift =
PRs with Scope or Intent Mismatch / Total PRs Reviewed
Use this to detect whether implementation is moving away from the agreed intent.
Verification tax
Verification Tax =
Additional Review Time
+ Rework Time
+ AI Output Validation Effort
Use this to estimate the real cost of validating AI-assisted work.
Capacity recovered
Capacity Recovered =
Time Saved by AI
- Verification Tax
- Enablement Time
Use this to avoid overstating productivity gains.
Release confidence
Release Confidence =
Verified Evidence Items / Required Evidence Items
Use this to measure whether a release is supported by sufficient evidence.
These formulas do not need to be perfect on day one.
But they force the organization to stop treating AI value as a feeling.
They turn adoption into evidence.
What leaders should do next
A useful AI Scoreboard does not need to begin as a complex enterprise dashboard. It can start with one real workflow and grow from there.
Step 1 — Choose one workflow
Start where AI is already being used or where the organization expects value: issue-to-PR, spec-to-code, test generation, code review, incident analysis, documentation, customer support response, or internal knowledge search.
Step 2 — Define baseline metrics
Before changing the workflow, measure the current state: lead time, cycle time, review time, rework, defects, handoffs, blockers, and user impact. Without a baseline, ROI becomes storytelling.
Step 3 — Define AI’s role
Be explicit about what AI is expected to do. Will it draft, review, generate tests, summarize, classify, suggest, or execute? Different roles require different metrics.
Step 4 — Define verification
Decide how the output will be checked: what can pass through lightweight review, what needs peer review, what needs automated tests, what needs architecture or security review, and what needs governance approval. This is where the upcoming AI VAR discussion becomes essential.
Step 5 — Measure before and after
Compare the workflow after AI support, but do not look only at speed. Look at quality, rework, instability, human effort, user value, and business outcome.
Step 6 — Reinvest what is recovered
If AI saves time, decide where that capacity goes: better architecture, more experimentation, less technical debt, better documentation, more customer discovery, or more innovation. Capacity recovered is only valuable when it is intentionally redirected.
The fourth principle of The Human-AI Playbook
The first principle was:
11 agents are not a team.
The second principle was:
The first bad match is not failure.
The third principle was:
The same playbook won’t work for every team.
The fourth principle is:
If you measure only AI usage, you are watching the ball — not the game.
The organizations that win with AI will not be the ones with the highest number of licenses, prompts, or agents.
They will be the ones that build better scoreboards.
The ones that measure:
- performance,
- capability,
- quality,
- recovery,
- learning,
- value.
That is what turns AI adoption into real organizational progress.
Work with us
If your organization is adopting AI, the challenge is no longer just choosing tools.
It is learning how to redesign work, measure value, and build the capabilities that make AI useful at scale.
At Celerik, we help organizations move from AI tool adoption to Human-AI Work Design—redesigning workflows, roles, measurement systems, context practices, verification routines, and capability-building approaches so AI can create sustainable business value.
If your teams are using AI but leadership still cannot clearly see the return, the problem may not be the tool.
It may be the scoreboard.
If this conversation resonates with the challenges your organization is facing, we would be glad to help you design an adoption approach that is measurable, human-centered, and operationally grounded.
Follow the series
This article is part of The Human-AI Playbook, a series about how organizations can move from AI tool adoption to Human-AI Work Design.
Published so far:
- 11 Agents Are Not a Team
- The First Bad Match Is Not Failure
- The Same Playbook Won’t Work for Every Team
- The AI Scoreboard
Next up:
The AI VAR — How AI-Native Teams Design Verification, Trust Calibration, and Accountability
Explore the full Human-AI Playbook series: